Fig 1
(Click on the figure to get a bigger version)
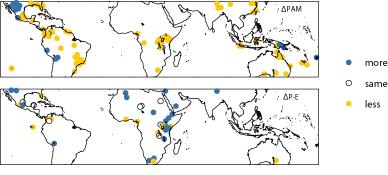
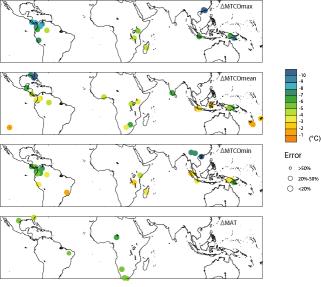
The LGM Tropical Terrestrial Data Synthesis (Farrera et al., 1999) contains quantitative reconstructions of mean temperature of the coldest month (MTCO) and mean annual ground temperature (MAT), and qualitative reconstructions of plant-available moisture (PAM) and runoff (equivalent to precipitation minus evaptranspiration, P-E) from radiocarbon-dated terrestrial sites between 32° N and 33° S with records for the last glacial maximum (defined as 18,000±1000 yr B.P. on the radiocarbon time scale, equivalent to 21,000 yr B.P. on the calendar time scale). The data set was explicitly compiled to provide an evaluation data set for LGM simulations. The dataset combines multiple indicators of quantitative changes in land surface temperature (pollen and plant macrofossil records of mean temperature of the coldest month = MTCO, and noble gas and speleothem records of mean annual temperature = MAT) and qualitative indicators of moisture balance parameters (pollen and plant macrofossil records of PAM and lake status records of P-E). The use of multiple indicators allows the consistency of the temperature and moisture balance reconstructions to be evaluated. The original publication lists all tropical sites with climate estimates - many of these sites were unsuitable for making quantitative reconstructions or were extremely poorly dated, and so do not appear on the maps. The complete list of sites is available on request.

Fig 1
(Click on the figure to get a bigger version)
PAM and P-E are complementary measures of the water balance in that run-off is the water that is not used by plants (Prentice et al., 1992a). However, in those regions where there are both kinds of data, the observed changes at the LGM between 32° N and 33° S are in the same direction. Both indicators show conditions drier than today at the LGM across most of the tropics and subtropics, except in the Great Basin, E. Africa and at high elevations in South America and Papua New Guinea. Lakes in northern Africa, supplied by run-off from the Atlas Mountains, also show wetter conditions.

Fig 2
(Click on the figure to get a bigger version)
The regional changes in MAT and MTCO at the LGM are broadly similar at low latitudes because the low seasonality of insolation in the tropics offers little scope for seasonal changes in temperature, but the two variables differ systematically in the northern subtropics as seasonal differences become greater.
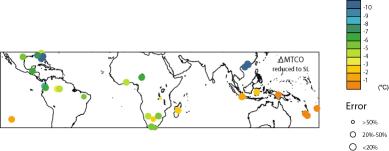
The temperature-induced shifts in the elevation of vegetation belts on tropical mountains are typically larger at high elevations, indicating steeper lapse rates at the LGM. The apparent lapse rates were steeper by ca 1.3°C/km in the circum-Indian Ocean region, and by at least 2.3°C/km in the circum-Pacific region. Farrera et al. (1999) used estimated regional lapse rates to estimate temperature changes at sea level (using only sites <1500m above modern sea level). The zonal average cooling in the tropics was ca 3°C cooler than today at modern sea level, but the magnitude of the cooling was far from spatially uniform.

Fig 3
(Click on the figure to get a bigger version)
The LGM Tropical Terrestrial Data Synthesis has records for 85 sites with records of PAM, 42 sites with records of P-E, 64 sites with record for temperature at the site elevation, and 34 sites with records of temperature reduced to sea level. If you wish to use the global data set, you should cite Farrera et al. (1999) as the sources of the original data, and the following website http://www.bridge.bris.ac.uk/pmip2/synth/index.htm.